
We're very exited to bring all the error monitoring and debugging capabilities of Rollbar to Salesforce Apex applications. According to Salesforce, millions of developers and thousands of independent software vendors develop customized applications using Apex to extend the fuctionality of Salesforce.
A few months ago, when some of our customers reached out and asked us for an error monitoring solution for their Salesforce Apex developers, our engineering team jumped on the task. The result - you can now monitor multiple organizations, apps, and users in real-time with one tool in one view. No more digging through emails or the developer console to find unhandled exceptions.
Get real-time error notifications with stack traces
For those unfamiliar with Rollbar, here’s a quick look at some of the key features -
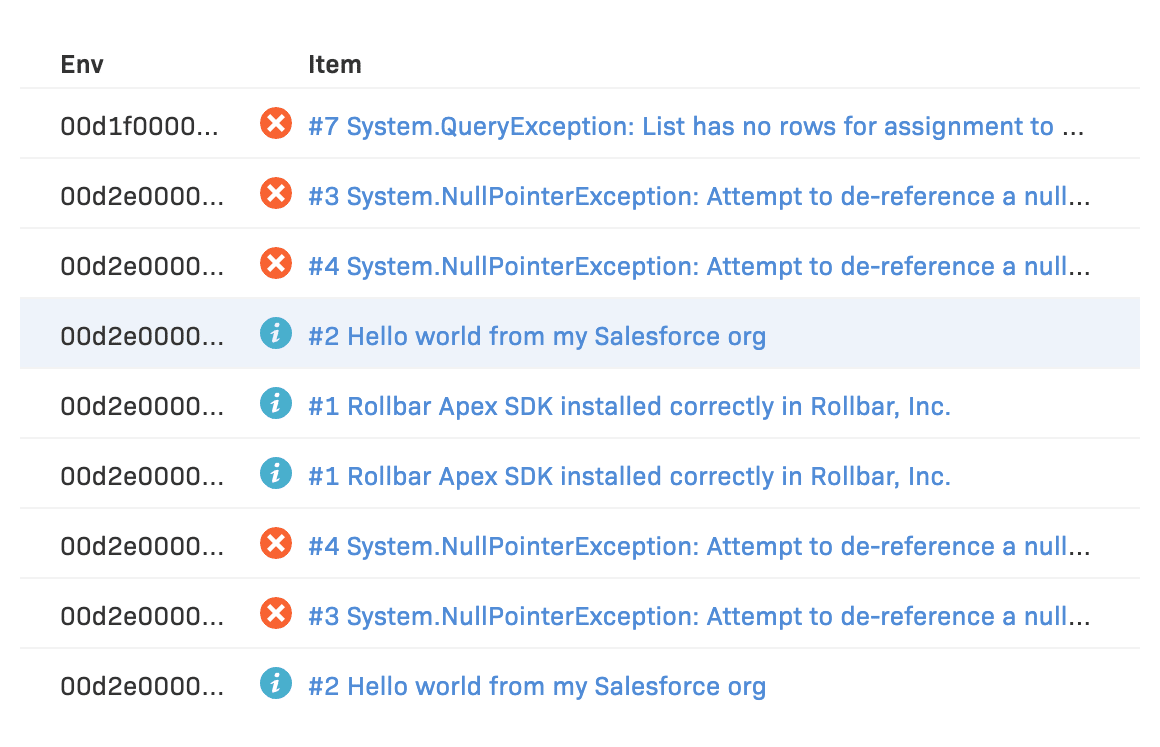
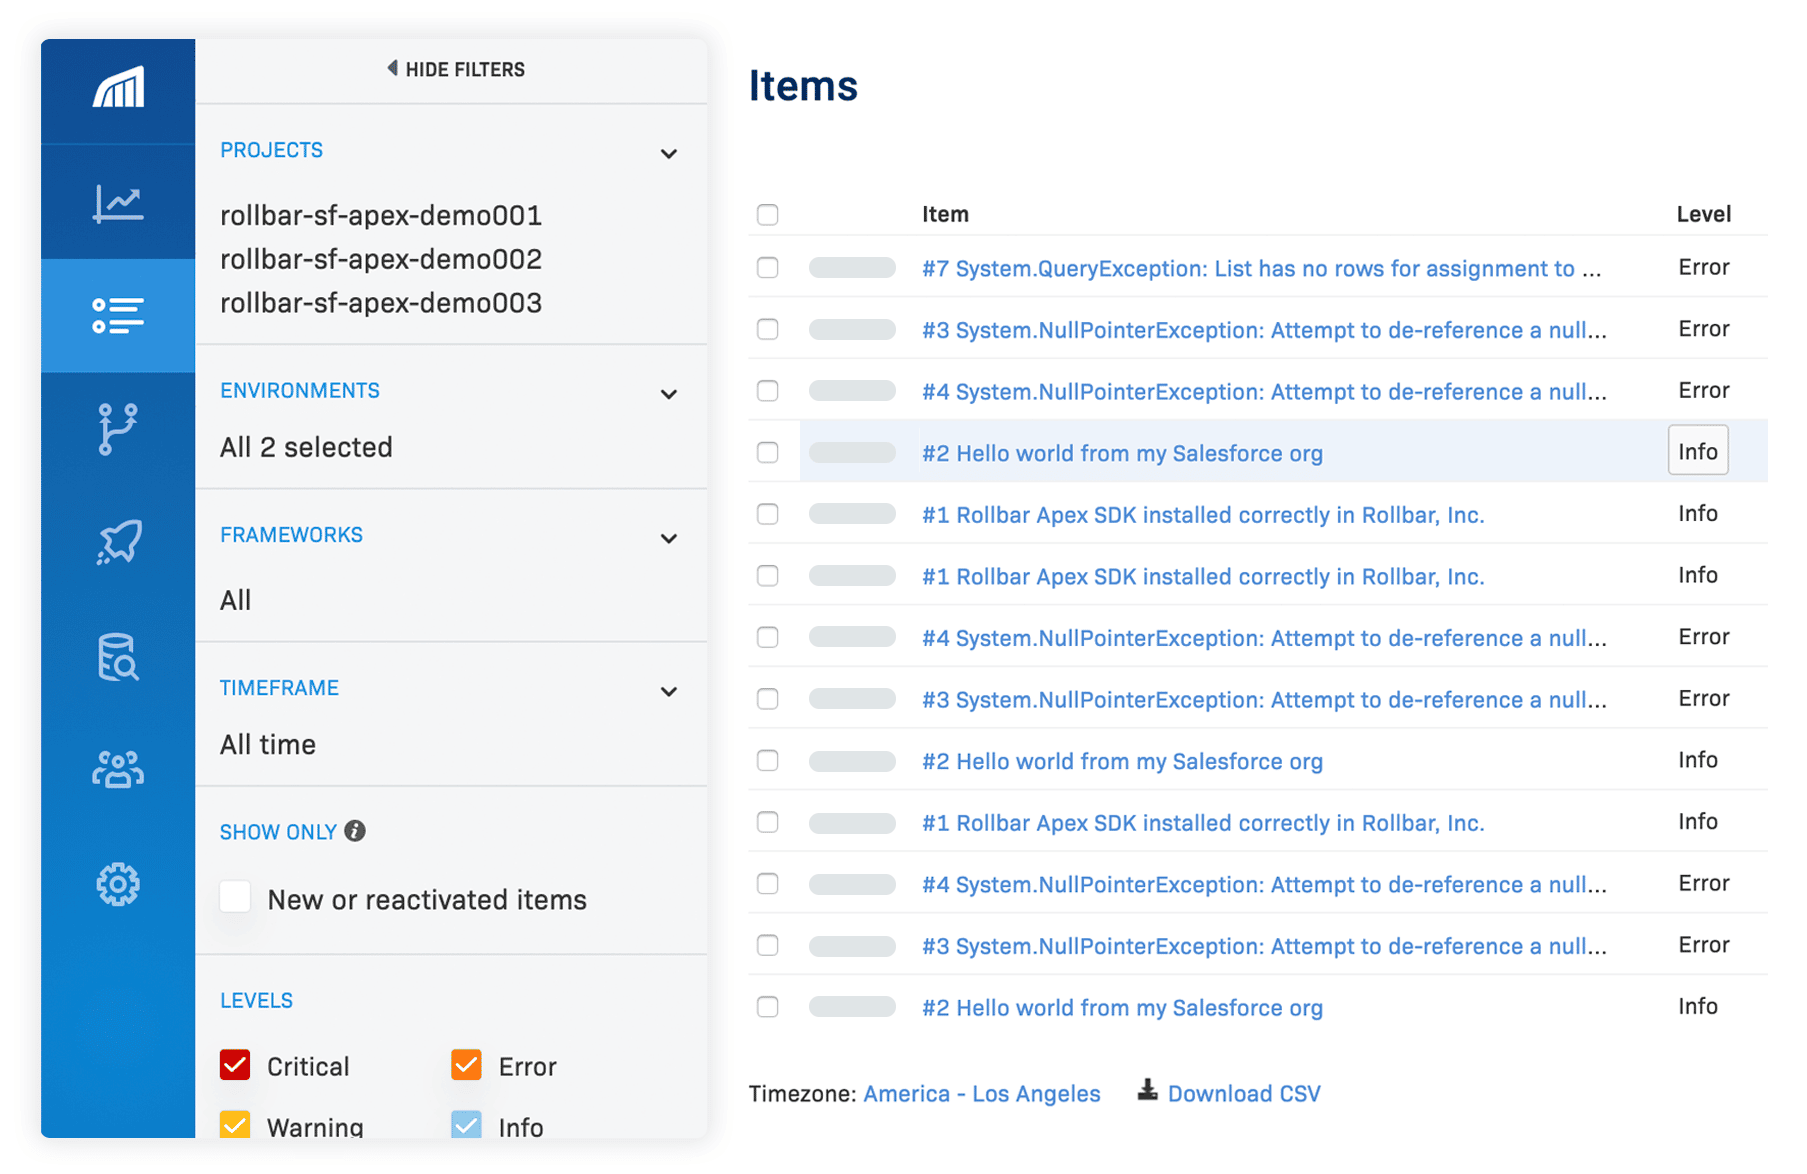
- Rollbar tracks all Apex errors instantly as they occur and notifies you via your preferred channel (slack, email, and more). You can view all Unhandled Apex Exceptions in all your Salesforce apps in one consolidated view on the Items page
- With advanced filters such as multi-project selector, timeframe, error severity, you can monitor all applications, organizations, and users with one tool in one place
- We group similar errors using Rollbar's fingerprinting technology to reduce noise and all errors include detailed data to help you assess impact and assign priority. You can assign owners and create issues in your preferred issue-tracking tool directly from Rollbar
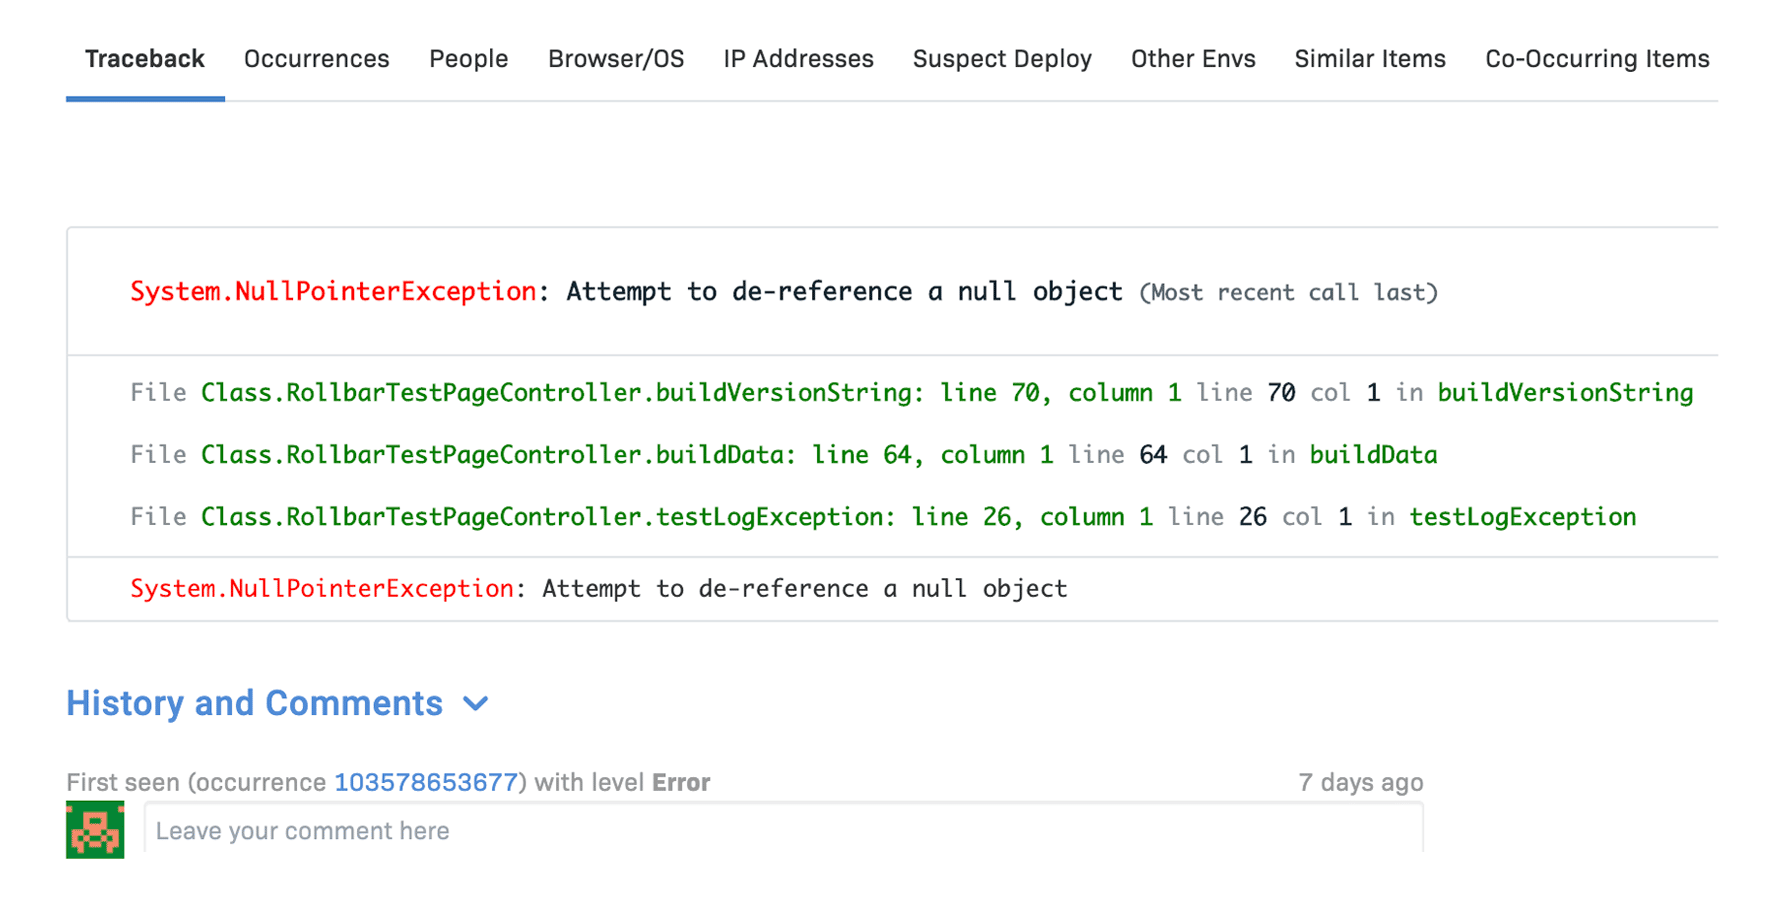
- You can see detailed metadata such as the stack trace, organization data, custom data with occurrences, request parameters, and more
Extending the Apex Error Handling & Debugging experience
If you’ve developed applications using Apex, you might be familiar with the Unhandled Exception Emails that may at times, er, pile up. We made everything accessible in a single view on the Rollbar dashboard, so you don’t have to spend time sifting through emails. Plus, a single click on any item will give you an overview of the item details including the stacktrace.
In the words of Artur Moczulski, our Head of Developer Experience, “The moment we got the first Apex stack traces to show up in Rollbar we knew we are onto something big. Little did I know we were actually opening up the Salesforce Apex world to modern error monitoring."
Faster Time to Market and Higher Productivity
Whether you’re building applications for your internal sales and customer success teams or for external clients, you don’t have to worry about missing errors in email threads anymore. The sales and customer service teams using the applications can always do their best work without any interruptions.
In addition, you can now get to market faster as developers can focus on iterating faster instead of worrying about the quality of the code with every version. At Rollbar, our mission is to help developers build software quickly and painlessly, and this is one step closer to bringing this mission to the world of Apex development.
Takes minutes to get started and get value
Seriously, we timed it. Setting up Rollbar for your Apex applications is very simple. You can visit our docs for installation inctructions.
Over the next few months, we’ll continue to roll out more features and metadata for the Apex SDK. Watch this space for more news or subscribe below if you want to be amongst the first to learn about this.
If you haven’t already, signup for a 14-day free trial of Rollbar and let us help you take control of your Salesforce Apex errors.