
Rollbar just got a much-requested feature: Source Maps support for Javascript. If you minify your Javascript code in production, this will make debugging production errors much easier. This feature is now live for all accounts.
{: .highlightbox}
Here's a link to a recently updated tutorial on using JavaScript source maps with Rollbar.
What Are Source Maps?
If you minify your Javascript code (i.e. using UglifyJS2 or the Closure Compiler), it gets harder to debug errors. Stack traces reference the line/column numbers in the minified code instead of the original source code.
Source Maps were designed to resolve this; they provide a mapping back from the minified line/column numbers to the original code. Chrome and Firefox have tools to use them in development, but what about errors that happen in production?
Source Maps and Rollbar
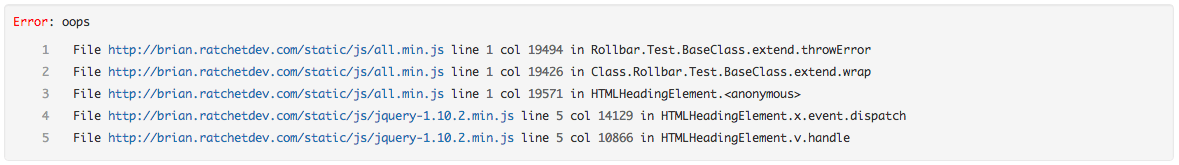
Rollbar can now map stack traces that reference minified code back to the original source files, lines, and column numbers. Here’s what a stack trace might have looked like before:
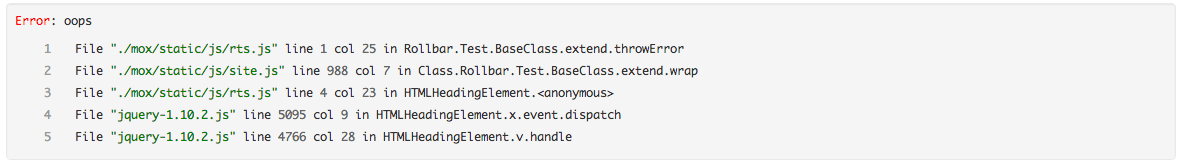
Here’s the de-minified version:
We’ll also use the de-minified stack trace in our grouping algorithm, which should result in more useful grouping.
Getting this set up
To get started, you’ll need to make a change to _rollbarParams in the on-page javascript snippet.
Add the following two parameters:
_rollbarParams = {
  // ... existing params ...
  // set this to 'true' to enable source map processing
  "client.javascript.source_map_enabled": true,
  // provide the current code version, i.e. the git SHA of your javascript code.
  "client.javascript.code_version": "bdd2b9241f791fc9f134fb3244b40d452d2d7e35"
}
Next, either: - Add a sourceMappingUrl comment at the end of your minified file to point to the source map - Upload the source map (along with all source files) separately, as part of your deploy process.
This second step is a bit more involved so please see our docs for more details.
Caveats
All of this relies on having a stack trace with line and column numbers. Unfortunately, browser support for column numbers is inconsistent. As of today, this will work in Chrome, Firefox, and IE10+, and only for caught errors reported like this:
try {
  doSomething();
} catch (e) {
  _rollbar.push(e);
}
Uncaught errors (reported via window.onerror) don’t have column numbers in any browser we’re aware of, so they aren’t able to be de-obfuscated. For best results, catch all your exceptions so you don’t fall back to the top-level error handler.
If you haven’t already, signup for a 14-day free trial of Rollbar and let us help you
defeat annoying javascript errors in your applications. 🙂